
President Obama Is Repeating The Same Pattern That Led President Clinton To 5 Balanced Budgets (that's 5 more balanced budgets than the last 5 Republican presidents -combined-)
see also: http://bureaucountydems.blogspot.com/p/national-debt.html

President Obama Is Repeating The Same Fiscal Responsibility Of His Democratic Predecessors see also: https://blogger.googleusercontent.com/img/b/R29vZ2xl/AVvXsEhlAhPOZyGsmZ0EROxGQFcToYmnitgQfoR-biirj6yu9kYMOcoqVPwKhVkQjwRWR9p_Ketd8rOZwYft2aarwI3CO2flPGLIKnVrIPMjj7C285MHyfuL1zaCeNV-kILJ9DBfjxdLam72W58/s640/Revenue_Spending_bypresident.jpg
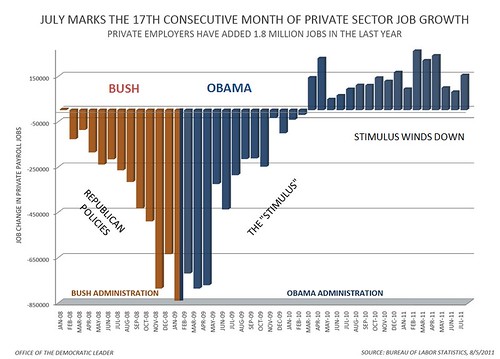
Prior to President Obama's stimulus, we were losing private sector jobs through 2008 at a rapidly accelerating pace.
During 2009, starting immediately after the stimulus passed in Feb 2009, the loss trend reverses.
We then begin to GAIN private sector jobs.
And here are two more detailed graphs on the dynamic between private and public sector job creation:
see also: http://bureaucountydems.blogspot.com/p/job-growth.html
see also: http://bureaucountydems.blogspot.com/p/national-debt.html
President Obama Is Repeating The Same Fiscal Responsibility Of His Democratic Predecessors see also: https://blogger.googleusercontent.com/img/b/R29vZ2xl/AVvXsEhlAhPOZyGsmZ0EROxGQFcToYmnitgQfoR-biirj6yu9kYMOcoqVPwKhVkQjwRWR9p_Ketd8rOZwYft2aarwI3CO2flPGLIKnVrIPMjj7C285MHyfuL1zaCeNV-kILJ9DBfjxdLam72W58/s640/Revenue_Spending_bypresident.jpg
Prior to President Obama's stimulus, we were losing private sector jobs through 2008 at a rapidly accelerating pace.
During 2009, starting immediately after the stimulus passed in Feb 2009, the loss trend reverses.
We then begin to GAIN private sector jobs.
And here are two more detailed graphs on the dynamic between private and public sector job creation:


States and localities have eliminated 671,000 jobs since employment peaked in August 2008" "Public" sector job creation remains the biggest drag on the overall employment issue.
President Obama Is Repeating The 80 Year Record Of Democratic Success In Job Creation
see also: http://bureaucountydems.blogspot.com/p/job-growth.html
YES WE CAN, AND YES WE HAVE!
Hope and Accomplishment
Hope and Accomplishment


No comments:
Post a Comment