-When Republicans blame Democrats for their economic incompetence it sounds like bullshit because it is bullshit-
by mike kohr 4/4/2012
http://en.wikipedia.org/wiki/File:Federal_Debt_1901-2010.png
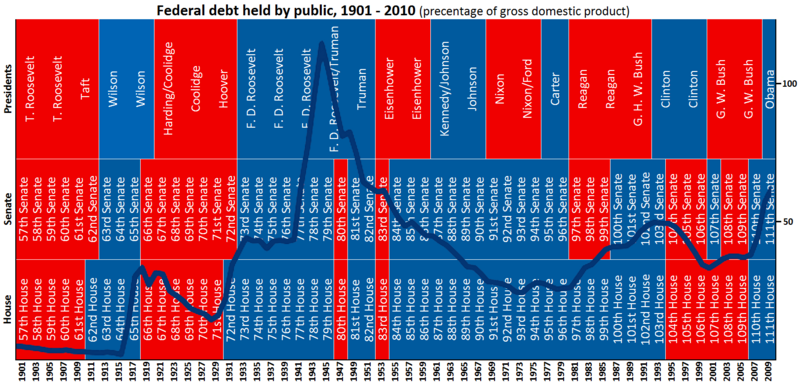
The complex chart above gives a great insight into the timeline of our National Debt. Click on it and expand the view and spend some time tracking the increases and declines. The chart is Debt compared to GDP the only true way to track National Debt.
A snap shot analysis shows 5 major spikes in growth of the National Debt:
1). 1915-1919, Democrat House and President, Cause: WW I2). 1933-1945, Democrat House and President, Cause: Republican gifted Great Depression & WW II
3). 1981-1993, Democratic House and Republican Presidents, Cause: Trickle Down Economics
4). 2001-2009, Republican House and Republican President, Cause: Trickle Down Economics
5). 2009-2012, R/D House, Democratic President, Cause: Republican gifted Great Recession and Trickle Down Economics.
Major Declines in National Debt:
1). 1919-1932, Republican House and Republican President, Result: The Great Depression
2). 1946- 1981 Democratic House and D/R Presidents. Result: Greatest pay down of debt in history
3). 1993-2000, D/R House and Democratic President. Result: Greatest economic boom in history.
A summary of the evidence is clear: debt is caused NOT just by spending but also by tax and economic policy, economic downturns, and war. Yet of the 5 spikes in National Debt, 4 have been caused Republican economic policy including nearly all of the most recent increases in National Debt.
Only 1 of the 5 spikes in National Debt occurred for reasons other than Republican economic policy and that was the spike of 1915-1919, caused by WW I.
Republicans are currently trying to deflect blame for the $9.2 trillion in debt ran up by the last 3 Republican presidents by blaming Democrat's control of the House of Representatives. The record of the last 100 years shows clearly that the single biggest pay down of National Debt occurred under the longest control of the House by Democrats, 1945-1981, and that steady record of fiscal responsibility was only broken by the advent of Reagan's budget busting Trickle Down Economics of tax give-a-ways to the rich.
When Republicans blame Democrats for their economic incompetence it sounds like bullshit because it is bullshit.


1) Deficit (On Budget)
ReplyDelete1961-present
Democratic Presidents’ deficits averaged 1.77% of GDP
Republican Presidents’ deficits averaged 3.42% of GDP
1981-present
Democratic Presidents’ deficits averaged 2.06% of GDP
Republican Presidents’ deficits averaged 4.09% of GDP
1a) Deficit (total)
Since World War II
Total Democratic Budget Deficits: $625.1 billion
Total Republican Budget Deficits: $4040.7 billion
Democratic Presidents’ deficits averaged 1.2% of GDP
Republican Presidents’ deficits averaged 2% of GDP
1961-present
Democratic Presidents’ deficits averaged 1.21% of GDP
Republican Presidents’ deficits averaged 2.37% of GDP
1981-present
Total Democratic Budget Deficits: $320.3 billion
Total Republican Budget Deficits: $3819.3 billion
Democratic Presidents’ deficits averaged 0.76% of GDP
Republican Presidents’ deficits averaged 2.67% of GDP
2) GDP Growth
Since World War II
Average GDP growth per year under Democratic Presidents: 4.05%
Average GDP growth per year under Republican Presidents: 2.88%
1961-present
Average GDP growth per year under Democratic Presidents: 4.09%
Average GDP growth per year under Republican Presidents: 2.81%
1981-present
Average GDP growth per year under Democratic Presidents: 3.7%
Average GDP growth per year under Republican Presidents: 2.81%
3) Business Investment Growth
Since World War II
Average growth per year under Democratic Presidents: 7.08%
Average growth per year under Republican Presidents: 2.94%
1961-present
Average growth per year under Democratic Presidents: 7.2%
Average growth per year under Republican Presidents: 2.95%
1981-present
Average growth per year under Democratic Presidents: 9.85%
Average growth per year under Republican Presidents: 2.29%
4) Unemployment
Since World War II
Average unemployment per year during Democratic Presidents: 5.03%
Average unemployment per year during Republican Presidents: 5.93%
1961-present
Average unemployment per year during Democratic Presidents: 5.33%
Average unemployment per year during Republican Presidents: 6.24%
1981-present
Average unemployment per year during Democratic Presidents: 5.20%
Average unemployment per year during Republican Presidents: 6.41%
5) Growth in Jobs
Since World War II
Average yearly growth in jobs under Democratic Presidents: 2,082,000
Average yearly growth in jobs under Republican Presidents: 1,167,000
Average yearly percent growth in jobs under Democratic Presidents: 2.67%
Average yearly percent growth in jobs under Republican Presidents: 1.36%
1961-present
Average yearly growth in jobs under Democratic Presidents: 2,391,000
Average yearly growth in jobs under Republican Presidents: 1,307,000
Average yearly percent growth in jobs under Democratic Presidents: 2.69%
Average yearly percent growth in jobs under Republican Presidents: 1.39%
1981-present
Average yearly growth in jobs under Democratic Presidents: 2,884,000
Average yearly growth in jobs under Republican Presidents: 1,253,000
Average yearly percent growth in jobs under Democratic Presidents: 2.37%
Average yearly percent growth in jobs under Republican Presidents: 1.17%
6) Growth in Pay
Since World War II
Average yearly growth in weekly earnings under Democratic Presidents: 0.83%
Average yearly growth in weekly earnings under Republican Presidents: 0.408%
1961-present
Average yearly growth in weekly earnings under Democratic Presidents: 0.48%
Average yearly growth in weekly earnings under Republican Presidents: -0.30%
1981-present
Average yearly growth in weekly earnings under Democratic Presidents: 0.84%
Average yearly growth in weekly earnings under Republican Presidents
-.34%See More
Do the same thing, but replace president with House of Representatives.
DeleteI am indebted to Kevin Collier for the above information which dovetails nicely with other pages and links on this blog.
ReplyDeleteBut pay special attention to Kevin's figures which show that the Republican economic model has NEVER worked, over time it actually produces worse and worse results. And they keep betting on a dead horse. Go figure.
So Republicans get credit for the Great Depression? What happened to the magic party switch of the 1960s? So the Republicans are Republicans unless you are talking about racism. Then the old Democrats are the current Republicans. Funny how you cut off the part of the chart that has the biggest spike since the Great Depression. Which was then brought down by a Republican House. Then spiked again as soon as Democrats took control of the House in 2007. Here's a chart for you that shows how the Dow does based on who controls the House. http://reynosawatch.org/minstrel/wp-content/uploads/2009/04/dow.png Looking forward to you censoring my post.
ReplyDelete