Governor Bruce Rauner, his shills, "The Illinois Policy Institute," and many on the right end of the political spectrum are weaving a web of deception by highlighting the fact that property taxes in Illinois are the 2nd highest in the nation. Their attempts to link LOCAL taxes to the totally unrelated 50 year underfunding of Illinois pension funds are misleading at best and when coupled with their frequent claims of taxes in Illinois being out of line with our neighbors are flat out lies.
Close examination of the facts lays the lie to their claims and actually points out that the "flat income tax" structure in Illinois coddles the wealthy at the expense of the middle class and the poor, a fact they'd rather not talk about.
The most relevant, apples to apples comparison, weights the total tax burden by percentage of income. Rated as a percentage of income Illinois ranks 14th out of 51 states and the District of Columbia.
http://www.e50plus.com/public/202.cfm
Ranked by percentage of income, Illinois has lower overall taxes than Indiana, Wisconsin, Minnesota, and Kentucky. Regionally only Iowa and Missouri has a lower overall tax burden and only by 1/2 of a % and 1% respectfully. We are not only in line with our regional neighbors, we are below the median.
If this distinction bothers you, ranked by tax dollars, CNN Money ranks Illinois at #29 out of 50 states. http://money.cnn.com/pf/features/lists/total_taxes/total.html No matter what standard you use Illinois is not one of the highest taxed states. It never has been, especially for the rich.
There is one category however, in which Illinois finds itself in shady company. Our "flat income tax" ranks us as among the worst states in exacerbating the historic income inequality gap by codling the wealthy and putting an undo burden on the Middle Class and the Poor.
http://www.vox.com/2015/7/6/8885375/map-inequality-states
This dubious trait is shared by many "Red States" and helps explain in part the historic economic underperformance of these states and regions of the country. If you've ever wondered why Lousiana, Mississippi, Tennesee and West Virginia have always been at the bottom of our national economic dog piles, the chart below points out a big reason why.
This convenient omission of this inconvenient fact by Governor Rauner, "The Illinois Policy Institute," and others of this ilk, cements together their fundamental dishonesty of policy and character. They should be ashamed. But they are not.
Showing posts with label Income inequality. Show all posts
Monday, July 27, 2015
Sunday, August 5, 2012
INCOME GROWTH BY PARTY, 1948-2005
If there was ever one chart that summed up success of Democratic Bubble Up Economic policy, this is it.
The 95th percentile, or the top 5% of income earners in the country, do better under Democratic Economic Policy, as does EVERY other percentile. And Democratic Economic Principle performs vastly better as you descend the economic dogpile. Targeting tax cuts and investment to the benefit of the working people in this nation helps everyone in this nation.
Thursday, June 7, 2012
Trickle Down Has Never Worked. Not Once.
It added $9.2 trillion to the national debt.
see: http://bureaucountydems.blogspot.com/p/national-debt.html
It's produced less than 1/2 the job growth of Democratic Bubble Up Economic Principle. see: http://bureaucountydems.blogspot.com/p/job-growth.html
It's been in place for 4 of the last 4 recessions including 2 of the 3 greatest economic downturns in our nation's history.
see: http://bureaucountydems.blogspot.com/p/history-of-recessions.html
It's produced the greatest income inequality in history. see: http://bureaucountydems.blogspot.com/p/income-inequality-99-versus-1.html
Romney is doubling down on the very economic principles that have all but killed the middle class and swelled the ranks of the poor. We should remember the record of the principles he champions.
see: http://bureaucountydems.blogspot.com/p/national-debt.html
It's produced less than 1/2 the job growth of Democratic Bubble Up Economic Principle. see: http://bureaucountydems.blogspot.com/p/job-growth.html
It's been in place for 4 of the last 4 recessions including 2 of the 3 greatest economic downturns in our nation's history.
see: http://bureaucountydems.blogspot.com/p/history-of-recessions.html
It's produced the greatest income inequality in history. see: http://bureaucountydems.blogspot.com/p/income-inequality-99-versus-1.html
Romney is doubling down on the very economic principles that have all but killed the middle class and swelled the ranks of the poor. We should remember the record of the principles he champions.
Monday, April 16, 2012
Compare Your Tax Rate To Multi-Millionaire Mitt Romney's Tax Rate
Hit on the link below to see how adopting the Buffet/Reagan Rule would help prevent multi-millionaires like Willard Romney from paying a lower tax rate than you.
We paid a tax rate of 20.9% last year. Romney's tax rate? 13.9%*
Mitt Romney would protect a tax code that allows millionaires like himself to take advantage of loopholes and tax havens. Well isn't that special?
We paid a tax rate of 20.9% last year. Romney's tax rate? 13.9%*
Mitt Romney would protect a tax code that allows millionaires like himself to take advantage of loopholes and tax havens. Well isn't that special?
"Who could have come up with such an evil tax scheme?"
"Could it be Satan?"
hit on link to do your personal calculation:
http://www.barackobama.com/buffett-rule?source=em12_20120416_sc_act&utm_medium=email&utm_source=obama&utm_campaign=em12_20120416_sc_act&email=mpkohr%40gmail.com&zip=61356
*latest available records. The Romneys filed an extention request on their 2011 tax returns.
Saturday, April 14, 2012
Sunday, February 5, 2012
Tuesday, January 17, 2012
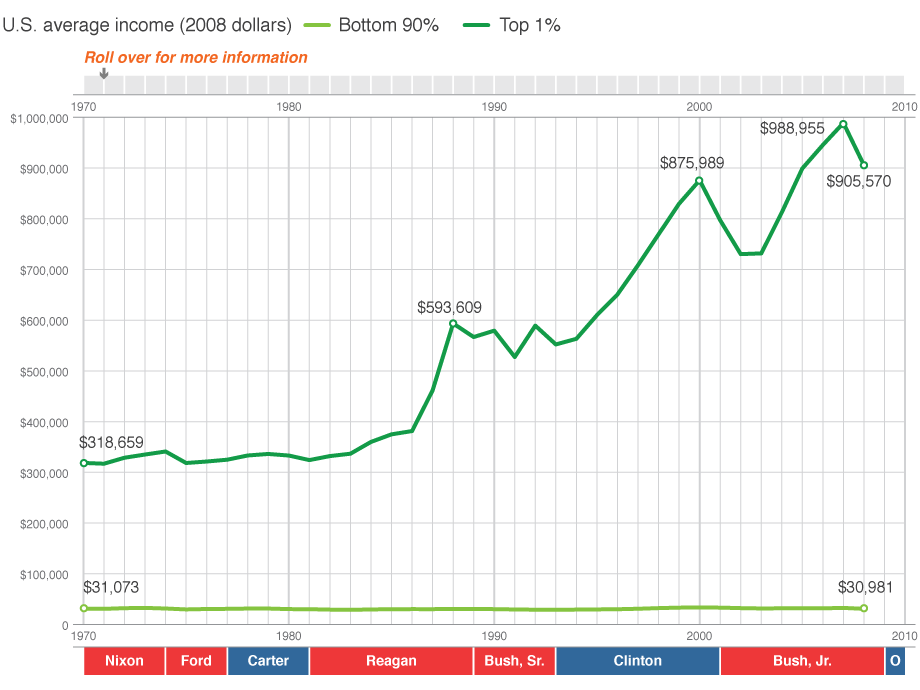
Shocking New Graph That Shines Light On What's Wrong With Our Economy
http://billmoyers.com/static/winner-take-all-infographic/chart.pngThat flat, light green line is the average income for the bottom 99% of Americans. It was $31,073.00 in 1970. Today is stands at $30,091.00, a decline of 3%.
The bright green line represents the upper 1%. In 1970 the average income for those folks was $318,659.00. Today it stands at $905,570.00, an increase of 284%.
And remember in November, todays entire slate of Republican candidates want to give further breaks to the upper 1% at the expense of the 99%.
Subscribe to:
Posts (Atom)